Devices Monitoring
The interface provides a monitoring dashboard for various refrigeration devices, including fridges, freezers, and a cold room. It's designed for clarity and quick access to the temperature and energy consumption data.
Key Components
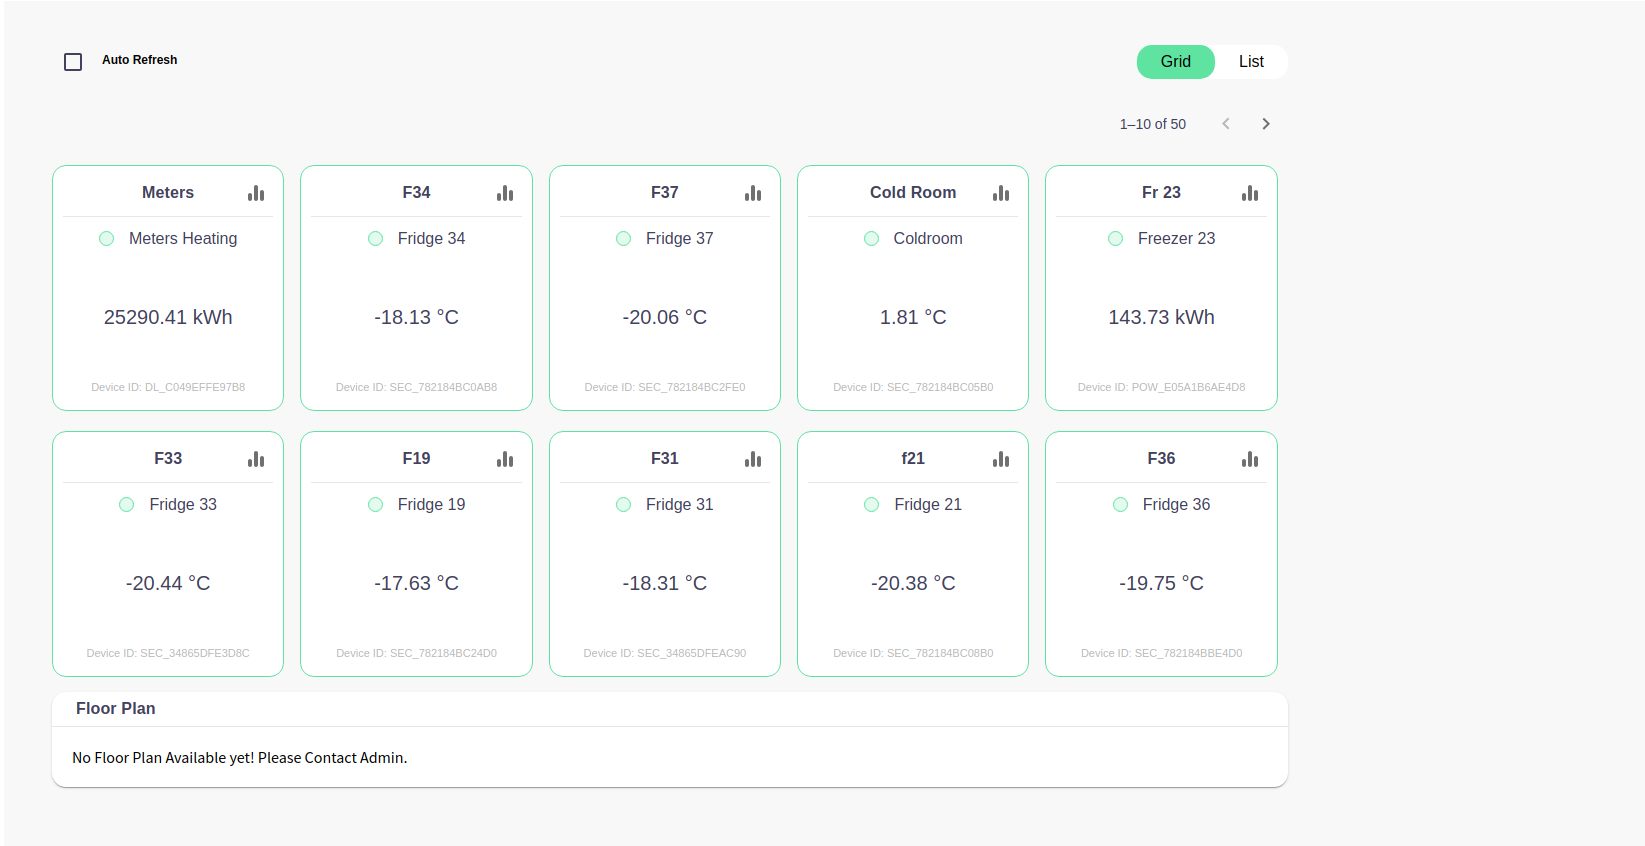
Auto Refresh
- A checkbox at the top left enables the auto-refresh feature, which likely updates the data shown on the dashboard at set intervals (60 seconds).
Device Cards
- Each device is represented by a card that displays the current temperature and, in one instance, the energy consumption.
- The cards are labeled with identifiers such as
F34,F37,Cold Room, andFr 23indicating different devices. - Temperatures are displayed in degrees Celsius, and energy consumption is shown in kilowatt-hours (kWh).
- Each card has a device ID, likely unique to each piece of equipment.
- On the Top Right corner of each card we have
AnalyticsIcon which is used to see data vs time series. Green and Red doton the Card orOutlineon the card indicates online and offline state of the devices.- If there will be any alert raised like sensor missing or over temperature then card colour will change to
Orange& show Alert button which will show Alerts related to same device.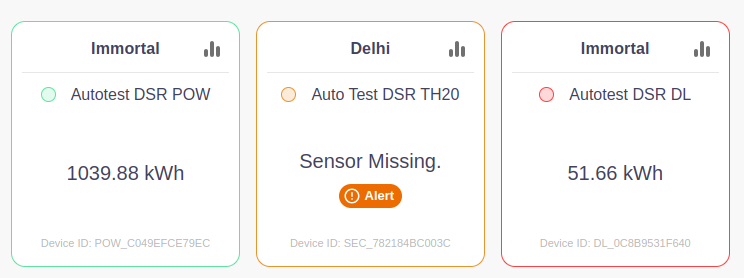
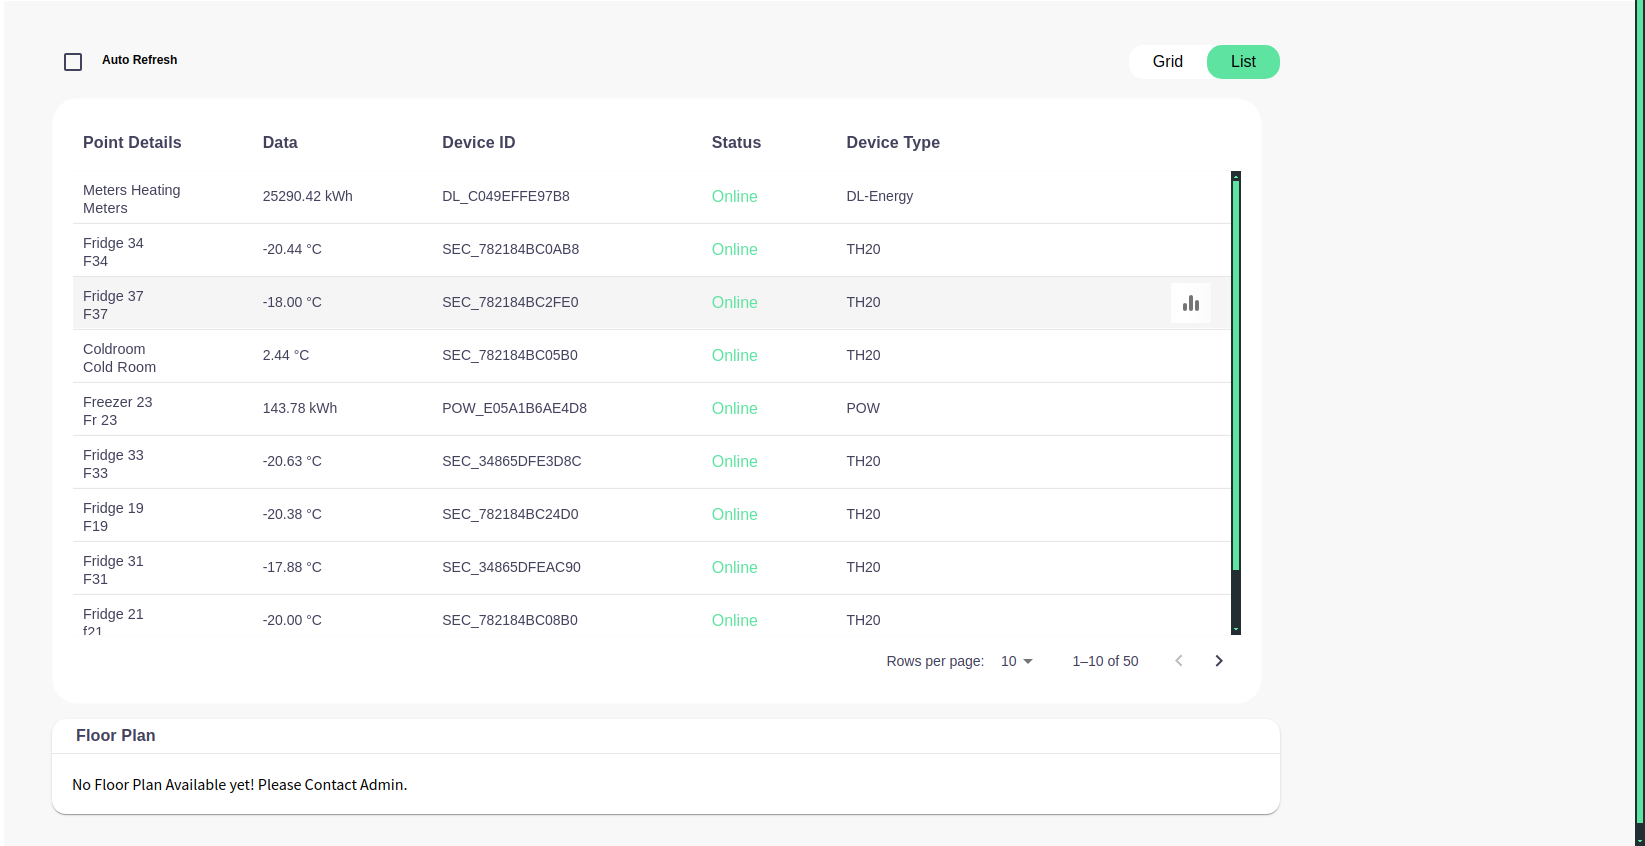
Layout Options
- At the top right, there are options to change the view layout between
GridandList. The current view is set toGrid.
Pagination
- The dashboard shows
1–10 of 50, indicating that there are more devices to monitor than can be displayed on a single page.
Floor Plan Section
- At the bottom, there's a message stating "No Floor Plan Available yet! Please Contact Admin." This indicates that a floor plan integration is intended but not currently available.
- Below a sample floor plan attached.
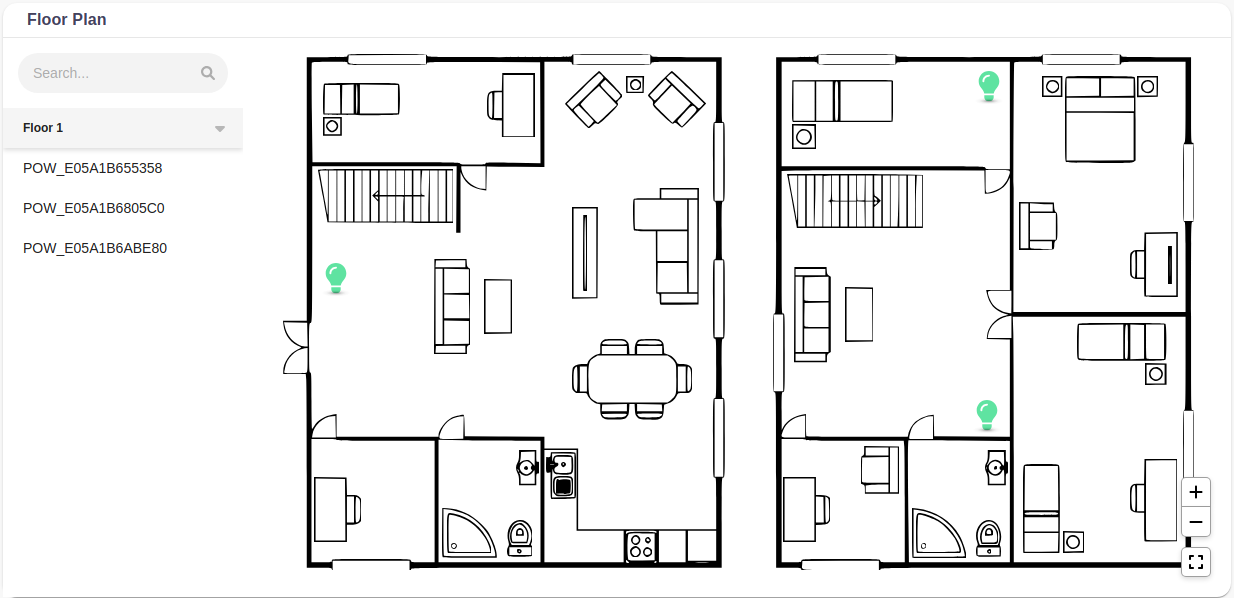
- On hovering the pointer on the icons of devices a pop over will open showing data about devices like temperature or kWh as shown below.

Summary
The dashboard is designed for a user, such as a facility manager, who needs to monitor the temperatures of refrigeration devices and the energy consumption of heating systems. The green outline of the cards and the negative temperatures suggest the primary focus is on maintaining required low temperatures for the storage of perishable goods.